-
Muhammad Adnan
- March 15, 2024
Top 6 Data Analysis Techniques in 2024
Decision making is crucial these days, and you can improve it no time ever before. Data analysis techniques have changed the course of understanding about the data. In this post, we will discuss techniques, patterns, correlations, trends, and help you to have a better understanding, and decision making about your business.
Once a scientist, Clive Humby said that “Data” is the new Oil”. Initially, the statement was not that much compelling, but today after two decades, the metaphor is true. We know that Oil is the most expensive and valuable resource, same as the data.
However, it is necessary to refine, and extract data that is worth taking for your business or company. Therefore, it is necessary to have data analysis skills or or hire someone with the skills to analyse data to get valuable insights. It helps companies to use data to drive into actionable insights to generate value. But surrounded by a plethora of data, the next question that comes is, what do we do with it?
In this post we will discuss the advanced data analytics techniques. It will help you and allow you to deliver optimal business outcomes. After reading this post, you being a data analyzer get to know how to use the meaningless data into a meaningful one. You will learn about the advanced enterprise data analytics techniques, but before we do it, let’s have an understanding of data analytics.
Advanced Data Analytics In a Nutshell!
Data analytics is a method that is useful for automating business processes through a variety of data science techniques. It includes machine learning, predictive modeling, and various other statistical methods.
Advanced data analytics is a kind of data analysis method that allows companies to enhance their efficiency to make affirm decisions through data.
So, data scientists use advanced analytics practices to develop patterns and probabilities for future events with the help of data science applications that overshadow traditional business intelligence practices.
Take a look at the advantages that you can get through data analytics services:
- Enhanced precision in predictive and forecasting models.
- Access deeper insights into market trends, consumer preferences, and behavior.
- Mitigate costly mistakes.
- Unlock new business prospects.
- Address critical issues with effective solutions.
- Accelerate decision-making processes.
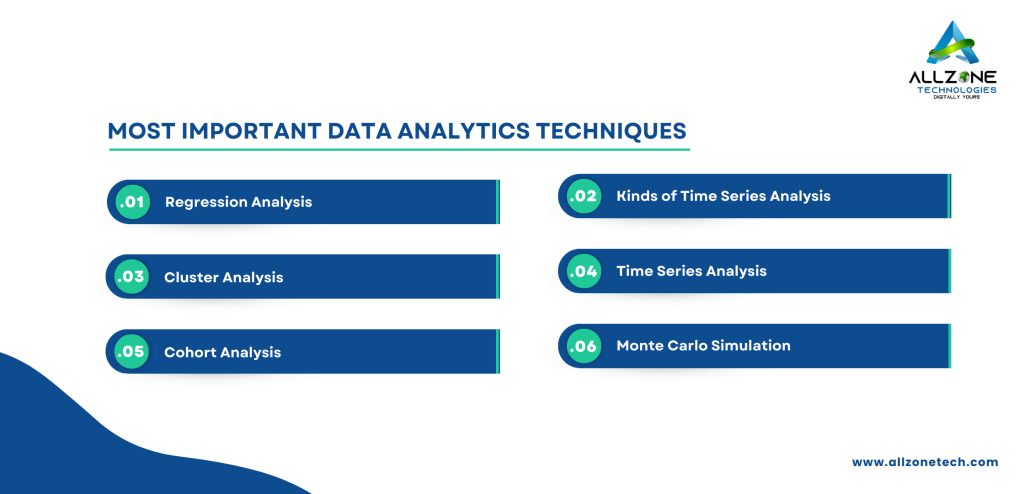
Most Important Data Analytics Techniques
Using data analytics techniques, you can gain multiple benefits in a competitive market. These are a few data analysis methods that are widely used by businesses.

1) Regression Analysis
Regression analysis is a process in which we analyze which variable has the most influence on another. These variables involve dependent and independent variables. Scientists perform regression analysis to find out which variables are important, which variables we can ignore, and which will hold significant importance in the future.
Through this procedure, you can identify potential volumes of sales and predict a rise in product prices.
Types of Regression Analysis:
Linear Regression: the dependent variable is continuous and the independent variable is continuous and discrete.
Logistic Regression: the dependent variable is binary, like 0/1, True/False, or Yes/No
Ridge Regression: information in which the independent variables are highly correlated.
Lasso Regression:
It employs an absolute value bias as opposed to the ridge regression’s square bias.
Polynomial Regression: utilized when the power of an independent variable exceeds one to analyze curvilinear data.
Applications of Regression Analysis:
- Time Series Forecasting
- Testing Automobiles
- Financial Forecasting
- Sales and Promotions Forecasting
- Weather Analysis and Prediction
2) Factor Analysis
Factor analysis uses the method of factors to reduce large numbers of variables into smaller ones. This method is also known as the data reduction or dimension reduction method. Factor analysis is a very popular technique for analyzing the correlation between variables. This instrument also analyses psychological aspects and socioeconomic status.
Types of Factor Analysis:
Principal Component Analysis: Finding the maximum variance allows us to extract the first factor. After that, the factor takes its place and this variance is eliminated.
Common Factor Analysis: A factor is extracted from a common variance and does not include the unique variance of overall variances.
Image Factor Analysis: This analysis works on a correlation matrix that uses predictive variables utilizing the OLS regression method.
Maximum Likelihood Approach: a technique used to estimate the value of the parameters of models.
Applications of Factor Analysis:
- Nutritional Science
- Data Mining
- Marketing
- Machine Learning
3) Cluster Analysis
Clutter Analysis is one of the data analytics techniques. It is helpful to describe data, and to point out general patterns. It is useful in a way where data is lacking from clear labels or has unknown or confused labelling. The entire process consists of spotting identical observations, and grouping them to develop clusters. Also, assign names, and categories to these groups.
Cluster analysis can identify similarities, and differences within the datasets. Further, present them visually to equip easy comparisons. However, Box plot visualization is useful to illustrate data clusters in this method.
Kinds of Cluster Analysis
Centroids-based Clustering (Partitioning methods)
Distribution-based Clustering
Connectivity-based Clustering (Hierarchical clustering)
Constraint-based (Supervised Clustering)
Density-based Clustering (Model-based methods)
Fuzzy Clustering
Cluster Analysis Applications
Geographic Information Systems (GIS)
Biology and Genetics
Image Segmentation
Document Clustering
Collaborative Filtering
4) Time Series Analysis
Time series analysis is a data analytics statistical technique that explains trends, cycles over time, and patterns. Time series data, like weekly sales metrics, and monthly email signups, and a set of data points that evaluate the same variables plenty of times. Here data analytics evaluate the future variations especially in variable interest by keeping an eye on time-related trends.
It requires a lot of data to progress reliability, and consistency. You can say it is a series of data points in a chronological order, and time series analysis works to read this data.
Kinds of Time Series Analysis
- Segmentation
- Explanative Analysis
- Exploratory Analysis
- Intervention Analysis
- Descriptive Analysis
- Curve Fitting
Applications of Time Series Analysis
- Quality Control
- Economic Forecasting
- Stock Market Analysis
- Energy Consumption Forecasting
- Traffic and Transportation
5) Cohort Analysis
It is one of the very common data analytics techniques. It enables us to break the data into many groups having common trades before the analysis. It is a technique that is very useful for optimizing customer retention and for better know-how of user behavior in a particular cohort. Moreover, It makes it easy for companies to analyze, isolate, and unveil trends in the lifetime of a user.
Kinds of Cohort Analysis:
- Acquisition Cohort Analysis
- Time-Based Cohort Analysis
- Demographic Cohort Analysis
- Retention Cohort Analysis
- Monetary Cohort Analysis
Applications of Cohort Analysis:
- Healthcare and Patient Outcomes
- Real Estate
- Social Sciences
- Subscription and Membership Services
- Product and Feature Performance
6) Monte Carlo Simulation
It is a mathematical practice that is very useful to evaluate uncertain events. Every prediction lies on rough data rather than a fixed one. Monte Carlo simulations are usually used by computers to assess data, and forecast outcomes following the course of action. However, data analytics techniques can determine the risk, and errors. It is also referred to as multiple simulation or Monte Carlo method.
Kinds of Monte Carlo Simulation
- Monte Carlo Tree Search (MCTS)
- Latin Hypercube Sampling (LHS)
- Markov Chain Monte Carlo (MCMC)
- Multi-Level Monte Carlo (MLMC)
- Rare Event Simulation
Applications of Monte Carlo Simulations:
- Optimization Problems
- Queueing Systems
- Natural Disaster Risk Assessment
- Climate Modelling
- Structural Analysis
- Reliability Analysis
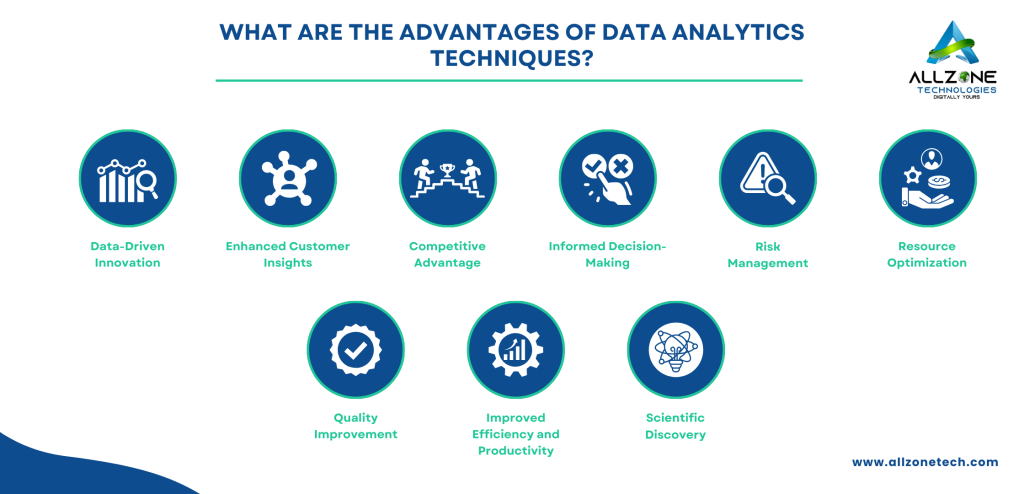
What Are Advantages of Data Analytics Techniques?

Data Analytics techniques provide plenty of advantages that enable companies or individuals across a variety of sectors. Here are the following key advantages that are as follows:
- Data-Driven Innovation
- Enhanced Customer Insights
- Competitive Advantage
- Informed Decision-Making
- Risk Management
- Resource Optimization
- Quality Improvement
- Improved Efficiency and Productivity
- Scientific Discovery
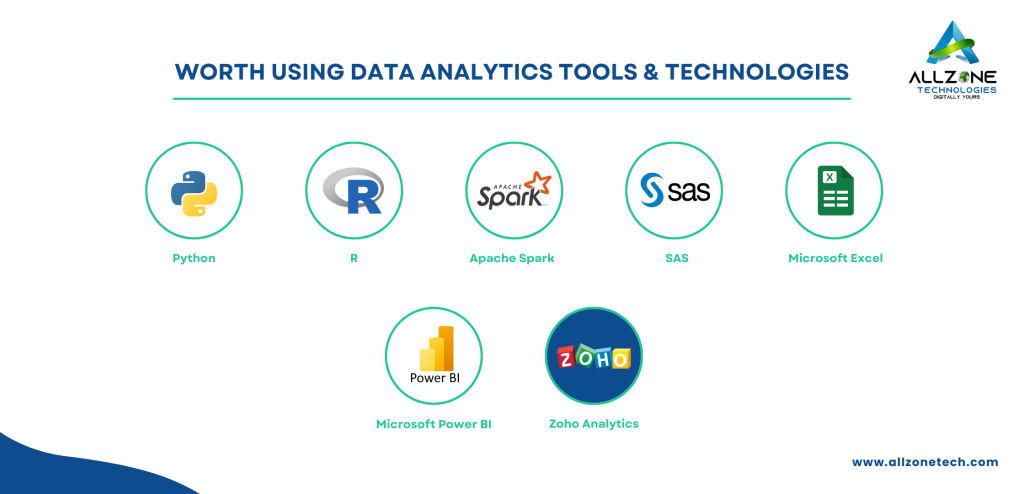
Worth Using Data Analytics Tools & Technologies

Here are some of the best data analytics tools and technologies we can consider:
You may be expecting every step involved in the data analysis approach for data analytics to have plenty of tools at their disposal. It empowers them to get mega insights from the data.
- Python
- R
- Apache Spark
- SAS
- Microsoft Excel
- Microsoft Power BI
- Zoho Analytics
Select Your Niche
The first and foremost important step in the cycle of custom IoT software development is to specify your niche. The Internet of Things constantly transforms almost every industry, from agriculture to IT and healthcare. Conducting thorough research before beginning the process of developing IoT applications can save you time and money. A few important things to consider before starting the development process are listed below.
- Formatting a plan for Software development
- Planning the workflow of the whole project
- An estimate of the resources needed
- Choosing the correct IoT platform
The next step is to determine which company is best suited for IoT development based on your niche and project requirements. Every company has its features and costs, so selecting the right one for your project can significantly impact it. Choosing the right platform can boost your productivity and efficiency while also providing valuable insights into the specific niche you want to work in. The following are some of the most popular IoT development platforms:
- Oracle IoT
- IBM Watson
- Android Things
- Xively
- Azure IoT Suite
Choosing suitable hardware
One of the most crucial aspects is choosing the proper hardware, which is responsible for transmitting data between two networks. All of the hardware components and power sources involved in the operation and functionality of software are categorized as hardware.
IoT Software Apps Should be Scalable
Internet of Things software must be scalable following the situations. Once you have made up your mind to develop an IoT app, ensure the scalability. Especially when buying hardware and software.
Conclusion:
Are you struggling to gather huge data from anywhere? Let’s make the most of it in no time ever before with AllZone Technologies data scientists. Advanced analytics empower your companies to get valuable insights into your operations, and customers, and marketers can use many data analytics techniques. Our expert empowers you to set up your business requirements by optimizing internal processes. All you need to do is hire expert and highly skilled data analytics professionals who have deep knowledge of data analytics, and tools. Hire an experienced data, and analytics service provider, like AllZone Technologies to grow your company to the next level.

